Повышен ли риск развития эректильной дисфункции у пациентов с подагрой в сравнении с общей популяцией?
ПРЕДПОСЫЛКИ:
Целью настоящего систематического обзора и метаанализа была оценка возможной связи между подагрой и эректильной дисфункцией (ЭД).
МЕТОДЫ:
Исследования были отобраны путем тщательного поиска по базам данных EMBASE, Pubmed, CENTRAL и ISI Web of Science. По четырем электронным базам данных проводили поиск с даты начала их заполнения до последнего выпуска (март 2016 г.), без ограничения по языку. Эксперты просматривали публикации независимо и не знали о результатах поиска других экспертов. Данные извлекали в соответствии с заранее составленной формой сбора данных. Метаанализ проводили с помощью программного обеспечения RevMan 5.3.
РЕЗУЛЬТАТЫ:
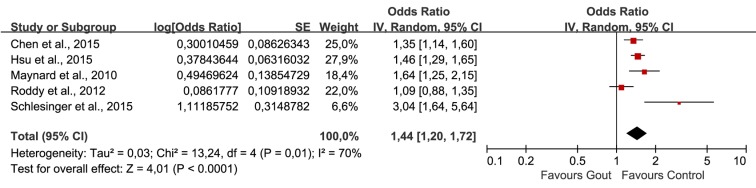
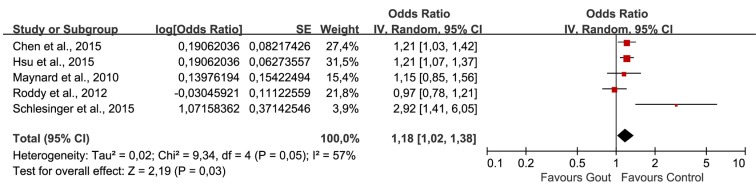
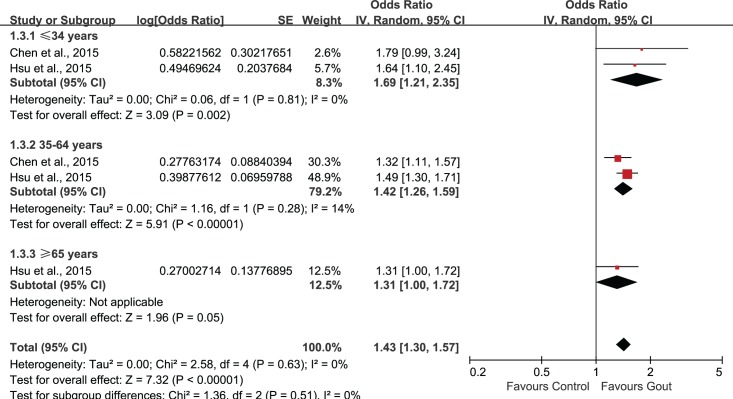
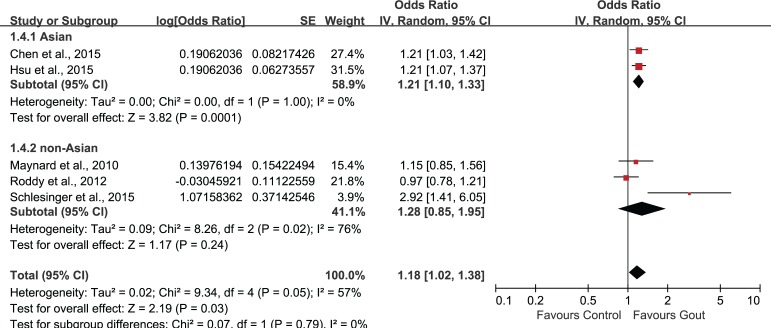
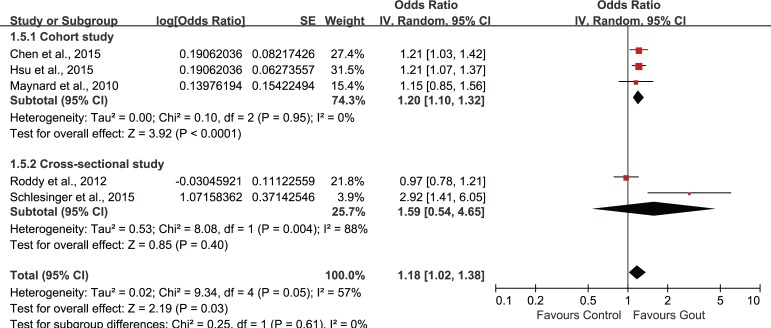
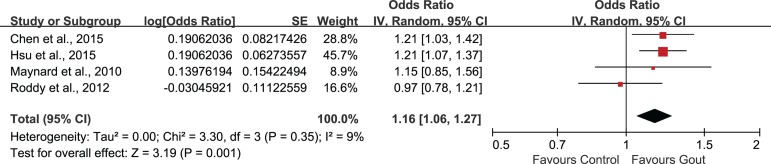
Было отобрано пять исследований, в которых участвовали в совокупности 56 465 пациентов (средний возраст = 49,11 лет) с подагрой и 155 636 пациентов без подагры (средний возраст = 48,76 лет). Объединенные нескорректированные отношения шансов (ОШ) показали, что у больных подагрой диагноз ЭД был в 1,44 раза более вероятен, чем в контрольной группе (95% доверительный интервал (ДИ): 1,02–1,72). Повышенный риск ЭД сохранялся и после внесения поправок на возраст и наличие сопутствующих заболеваний (1,18; 95% ДИ: 1,02–1,38). Анализ в подгруппах по возрасту показал статистически значимую связь подагры с ЭД во всех возрастных группах. Однако имелось недостаточно данных о причинно-следственной связи подагры и ЭД.
ВЫВОД:
Данный обзор показал положительную связь подагры с ЭД, но этот вывод в некоторой степени неоднозначен из-за гетерогенности выбранных исследований. В настоящее время требуются новые исследования на больших однородных популяциях, и рандомизированные контролируемые исследования, нацеленные на оценку влияния лечения подагры на показатели, характеризующие ЭД.

Xing-li Du,#1 Lei Liu,#2 Wen Song,3 Xiang Zhou,4 and Zheng-tao Lv5,*
PLoS One. 2016 Dec 30;11(12)
PMC: 5201298
DOI: 10.1371/journal.pone.0168784
![]()
Association between Gout and Erectile Dysfunction: A Systematic Review and Meta-Analysis.
BACKGROUND:
The aim of this systematic review and meta-analysis was to assess the possible association between gout and erectile dysfunction (ED).
METHODS:
Studies were identified by extensively searching EMBASE, Pubmed, CENTRAL and ISI Web of Science. Four electronic databases were searched from their inception date to the latest issue (March 2016), without language restriction. Each reviewer screened articles independently and was blinded to the findings of the other reviewer. Data was extracted in adherence to the predetermined data collection form and meta-analysis was conducted via RevMan 5.3.
RESULTS:
Five studies involving 56465 patients (mean age: 49.11 years) with gout and 155636 non-gout subjects (mean age: 48.76 years) were selected. The combination of unadjusted odds ratio (OR) showed that patients with gout were 1.44 times more likely to be diagnosed with ED when compared with control (95% confidence interval (95%CI) 1.20, 1.72). After adjustment for age and comorbidities, the heightened risk to develop ED was still present (1.18, 95%CI 1.02, 1.38). Subgroup-analysis by age showed statistically significant association of gout and ED in all age groups. However, evidence supporting a causal effect of gout on ED was insufficient.
CONCLUSION:
The findings of this review indicated a positive association of gout and ED, but this work is hampered by the heterogeneity among included studies, to some extent. Future studies with larger community-based homogeneous population and randomized controlled trials aimed to evaluate the effect of gout treatment on ED associated outcomes are needed at this point.
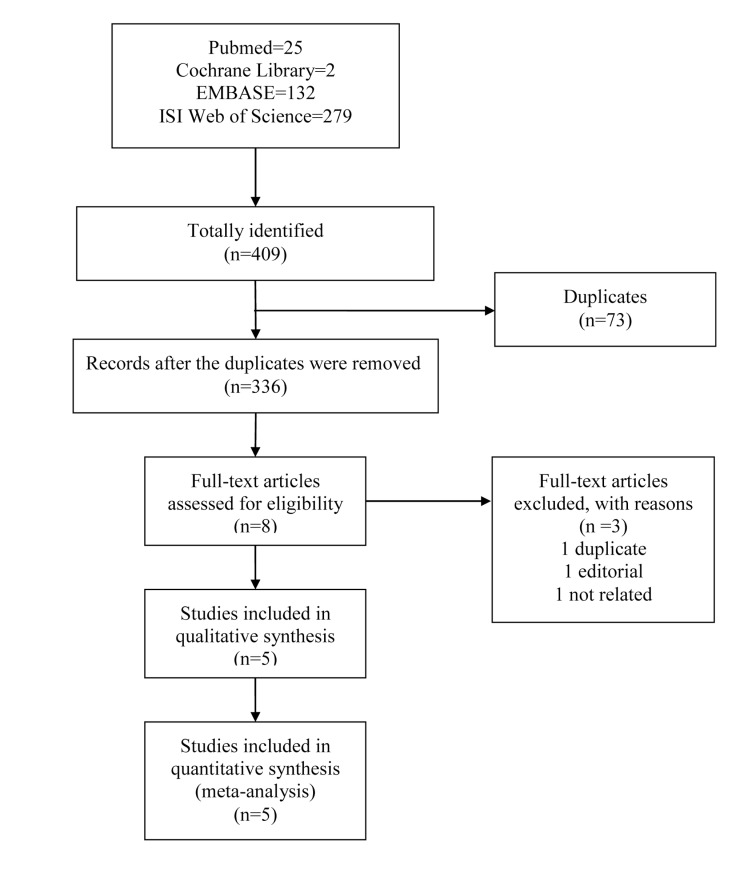
Table 1
Characteristics of included studies.
| Study | Population (ED/total) | Gout assessment | ED assessment | Adjustment for covariates | Follow-up | Results |
|---|---|---|---|---|---|---|
| • Chen, 2015 • Cohort study • Taiwan |
• Goat: 186/19368, 47.2±12 years • non-goat: 558/77472, 47.2±12 years |
• ICD-9-CM Code 274 • Diagnosed by physicians |
• ICD-9-CM Code 607.84 • identified by the urologists or physicians of internal or family medicine based on the patient’s medical record, recent symptoms, scores of the SHIM questionnaire, physical examination, and laboratory studies |
age, congestive heart disease, ischemic heart disease, hypertension, depression and chronic renal failure | from January 2002 to December 201 | • AOR: 1.21 (1.03, 1.44) • COR: 1.35 (1.14, 1.59) |
| • Hsu, 2015 • cohort study • Taiwan |
• Gout: 476/35265, 49.6±16.2 years; • non-gout: 634/70529, 49.1±16.5 years |
• ICD-9-CM code 274 | PED or OED (ICD-9-CM codes 302.72 and 607.84) | age and coronary artery disease, peripheral arterial disease, chronic kidney disease, hypertension, diabetes, hyperlipidemia, depression and anxiety | • gout: 7.44±3.20 years • non-gout: 7.68±3.09 years |
• AOR: 1.21 (1.07, 1.37) • COR: 1.46 (1.29, 1.64) |
| • Maynard, 2010 • cohort study • USA |
• Gout: 102/256, 68.7±11.3 years; • non-gout: 677/2349, 65.0 ±12.3 years |
health professional diagnosis of gout | health professional diagnosis of ED | age, hypertension, obesity and diabetes | N.R. | • AOR: 1.15 (0.85, 1.53) • COR: 1.64 (1.25, 2.13) |
| • Roddy, 2012 • cross-sectional study • UK |
• Gout: 116/1292, 59.9 years; • non-gout: 429/5168, 59.9 years |
identified via Read codes | identified via Read codes | ischemic heart disease, hypertension, diabetes mellitus, and prescription of diuretics, anti-hypertensives, H2 antagonists and anti-depressants | N.R. | • AOR: 0.97 (0.78, 1.22) • COR: 1.09 (0.88, 1.35) |
| • Schlesinger, 2015 • cross-sectional study • USA |
• Gout: 63/83, 56.67±14.29 years; • non-gout: 60/118, 53.52±13.70 years |
Reassessed retrospectively by investigating the medical reports | SHIM score: absent (22–25), mild (17–21), mild to moderate (12–16), moderate (8–11), and severe (1–7) | age, depression, diabetes, fasting glucose, HTN, elevated cholesterol level, prostate disease, GFR, and heart disease | N.R. | • AOR: 2.92 (1.41, 6.06) • COR: 3.04 (1.64, 5.66) |
ED: erectile dysfunction; OED: organic erectile dysfunction; PED: psychogenic erectile dysfunction; COR: crude odds ratio; AOR: adjusted odds ratio; 95%CI: 95% confidence interval; HTN: hypertension; GFR: glomerular filtration rate; N.R.: not reported.
Table 2
Risk of bias assessment of cohort studies.
| Item/Study | Chen et al., 2015 | Hsu et al., 2015 |
|---|---|---|
| Selection | ||
| 1) Representativeness of the exposed cohort | * | * |
| 2) Selection of the non-exposed cohort | * | * |
| 3) Ascertainment of exposure | * | * |
| 4) Demonstration that outcome of interest was not present at start of study | * | * |
| Comparability | ||
| 1) Comparability of cohorts on the basis of the design or analysis | ** | ** |
| Outcome | ||
| 1) Assessment of outcome | * | * |
| 2) Was follow-up long enough for outcomes to occur | * | * |
| 3) Adequacy of follow up of cohorts | * | * |
| Total score | 9/9 | 9/9 |
A study could be awarded a maximum of one star (*) for each item within the selection. A maximum of two stars (**) can be given for comparability and selection. The definition/explanation of each column of the Newcastle-Ottawa Scale is available from (http://www.ohri.ca/programs/clinical_epidemiology/oxford.asp.).
Table 3
Risk of bias assessment of cross-sectional studies.
| Item/Study | Schlesinger et al., 2015 | ||
|---|---|---|---|
| Yes | No | Unclear | |
| 1) Define the source of information (survey, record review) | √ | ||
| 2) List inclusion and exclusion criteria for exposed and unexposed subjects (cases and controls) or refer to previous publications | √ | ||
| 3) Indicate time period used for identifying patients | √ | ||
| 4) Indicate whether or not subjects were consecutive if not population-based | √ | ||
| 5) Indicate if evaluators of subjective components of study were masked to other aspects of the status of the participants | √ | ||
| 6) Describe any assessments undertaken for quality assurance purposes (e.g., test/retest of primary outcome measurements) | √ | ||
| 7) Explain any patient exclusions from analysis | √ | ||
| 8) Describe how confounding was assessed and/or controlled | √ | ||
| 9) If applicable, explain how missing data were handled in the analysis | √ | ||
| 10) Summarize patient response rates and completeness of data collection | √ | ||
| 11) Clarify what follow-up, if any, was expected and the percentage of patients for which incomplete data or follow-up was obtained | √ | ||
The definition/explanation of each column of the Agency for Healthcare Research and Quality is available from (http://www.ahrq.gov/research/findings).